Benchmark definition
The DEM Benchmarks consist of a set of 9 simple tests which are run every night and whose object is to make sure both that the application performs correctly and that the code did not break after the daily changes. They are the following:
Benchmark 1: Elastic normal impact of two identical spheres
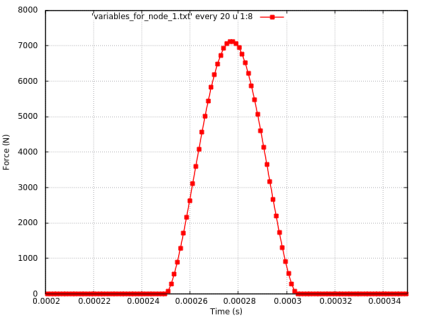
The diagram shows the time evolution of the elastic contact force between two identical elements.
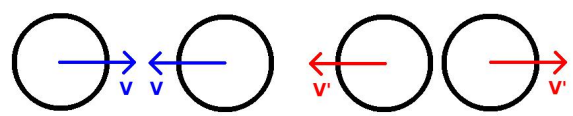
The velocity after the impact depends on the coefficient of restitution value. For COR=1 the module of the initial and final velocities should be the same. Furthermore, velocities should be equal for both spheres.
Results
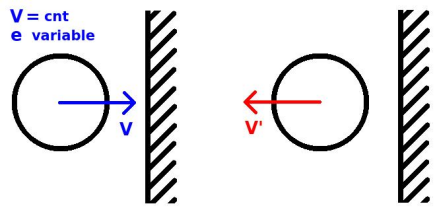
Benchmark 2: Elastic normal impact of a sphere against a rigid wall
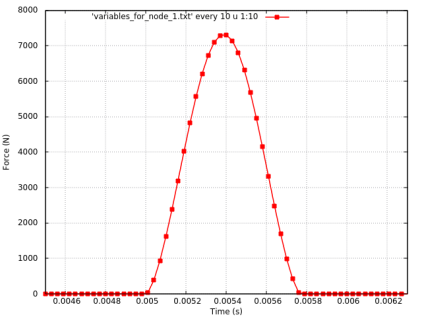
The diagram shows the time evolution of the elastic contact force between a discrete element and a finite element.
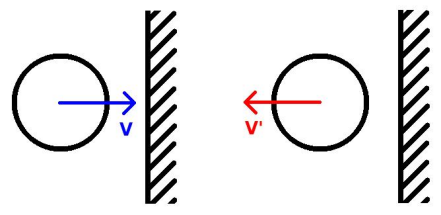
The velocity after the impact depends on the coefficient of restitution value. For COR=1 the module of the initial and final velocities should be the same.
Results
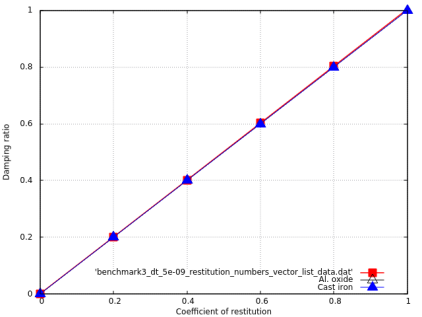
Benchmark 3: Impact of a sphere against a rigid wall with different coefficients of restitution
The diagram shows the effect of different restitution coefficients on the damping ratio.
If total energy of the system is conserved, the restitution coefficient and the damping ratio values should be identical.
Results
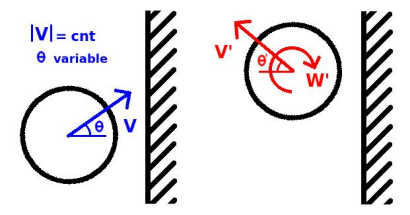
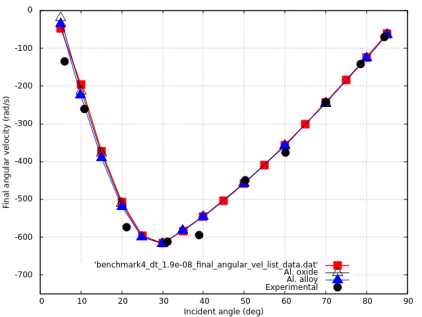
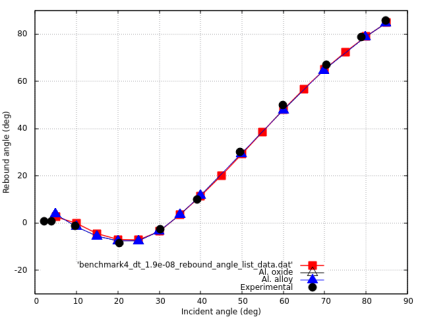
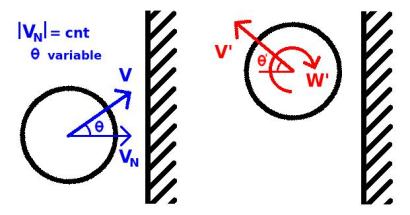
Benchmark 4: Oblique impact of a sphere with a rigid plane with constant velocity module and variable incident angles
The diagram shows the tangential restitution coefficient, final angular velocity and rebound angle of the sphere.
Results
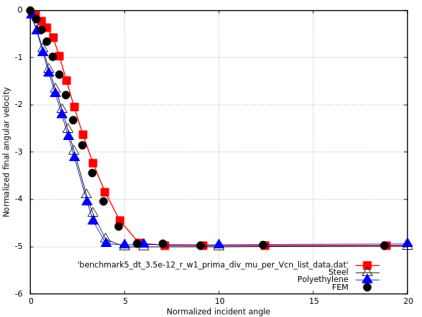
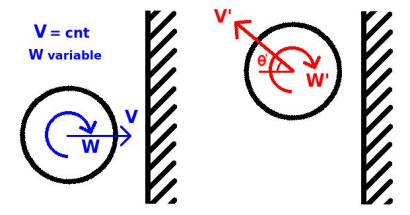
Benchmark 5: Oblique impact of a sphere with a rigid plane with constant normal velocity and different angular velocities
The diagram shows the final linear and angular velocities of the sphere.
Results
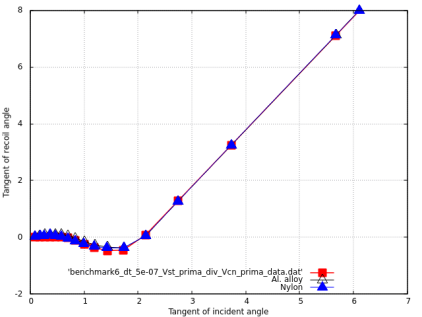
Benchmark 6: Oblique impact of a sphere with a rigid plane with constant normal velocity and different angular velocities
The diagram shows the final linear and angular velocities of the sphere.
Results
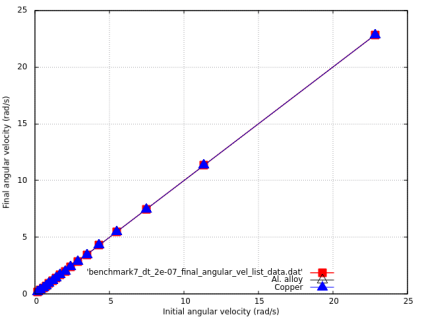
Benchmark 7: Impact of two identical spheres with a constant normal velocity and different angular velocities
The diagram shows the final linear and angular velocities of both spheres.
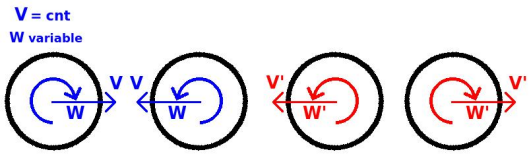
By symmetry, the tangential final velocity of both spheres should be zero. Additionally, for a coefficient of restitution of 1, there should be no changes in the modules of both linear and angular velocities and their values should conserve symmetry.
Results
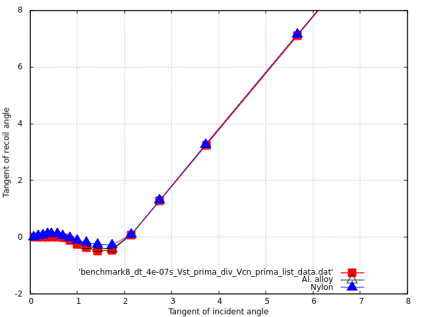
Benchmark 8: Impact of two differently sized spheres with a constant normal velocity and variable angular velocities
The diagram shows the final linear and angular velocities of both spheres.
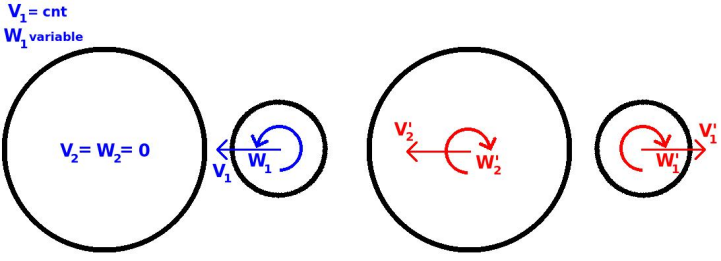
In this case, it is interesting to note that, the bigger and/or denser the second sphere is, the more this test resembles the sphere versus wall simulation.
Results
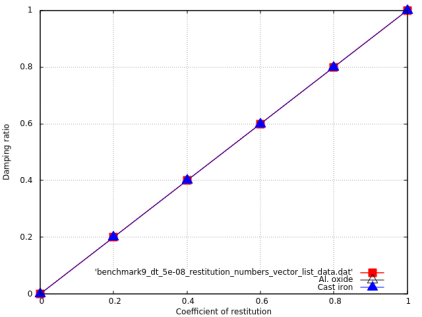
Benchmark 9: Impact of two identical spheres with a constant normal velocity and different coefficients of restitution
The diagram shows the effect of different restitution coefficients on the damping ratio.
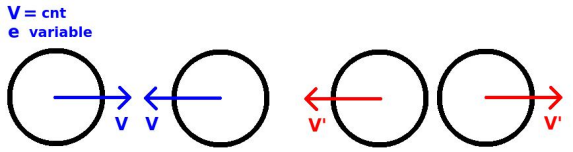
If total energy of the system is conserved, the restitution coefficient and the damping ratio values should be identical.
Results
References: Y.C.Chung, J.Y.Ooi. Benchmark tests for verifying discrete element modelling codes at particle impact level (2011).