Introduction
This page describes the basic usage of Valgrind, a debugging and profiling tool that keeps track of the memory used by your code. Valgrind runs on Linux systems, and can be obtained from the repository of some distributions (e.g. Ubuntu). Its official documentation can be found in http://valgrind.org/
Finding memory errors with Memcheck
Valgrind’s Memcheck tool is useful to look for unexpected access to the memory, which are likely related to bugs in your code. Typical examples of bugs that produce memory errors are writing past the end of an std::vector or wrong uses of pointers. To use Memcheck on your code, compile it (preferably in debug, as the output will be more detailed) and run it using
valgrind python your_script.py
You will probably want to redirect the output to a file or (better yet) run it from emacs using the compile option, as the program generates a lot of output and will quickly fill the terminal’s buffer. Note that you will likely find multiple errors that are not directly related to your code. Fortunately, Valgrind records the file and line the error generates from. You should be concerned by errors generated by your code or in functions called from your code. To help filter unwanted messages, the –suppressions option can be used, which hides all the errors of the types defined in a suppression file.
Both Python and OpenMPI trigger warning messages from Memcheck, which can be suppressed using suppression files provided in your installation. Assuming the default install folders in Ubuntu, you can suppress their errors running Valgrind as:
valgrind --suppressions=/usr/lib/valgrind/python.supp python your_script.py
for Python and:
mpirun -np 2 valgrind --suppressions=/usr/lib/valgrind/python.supp --suppressions=/usr/local/share/openmpi/openmpi-valgrind.supp python your_script.py
Additionally, you can get a more detailed output if you call Valgrind with the flag:
--leak-check=full
Analysing memory use with Massif
Another useful tool included in Valgrind is Massif, which provides a detailed analysis of the use of memory during the program’s execution. Compile your code and run it using:
valgrind --tool=massif python your_script.py
Once the execution is finished, Valgrind will generate an output file called massif.out.XXXX (where XXXX is your process’ id) that registers the memory used by the code at different times, organized by the object (and line of code) that wrote it. This file is typically large and using it directly is impractical, but fortunately there are tools that can be used to present it in a graphical form. One of such tools is massif-visualiser, which can be installed in Debian and derived distributions with:
sudo apt-get install massif-visualiser
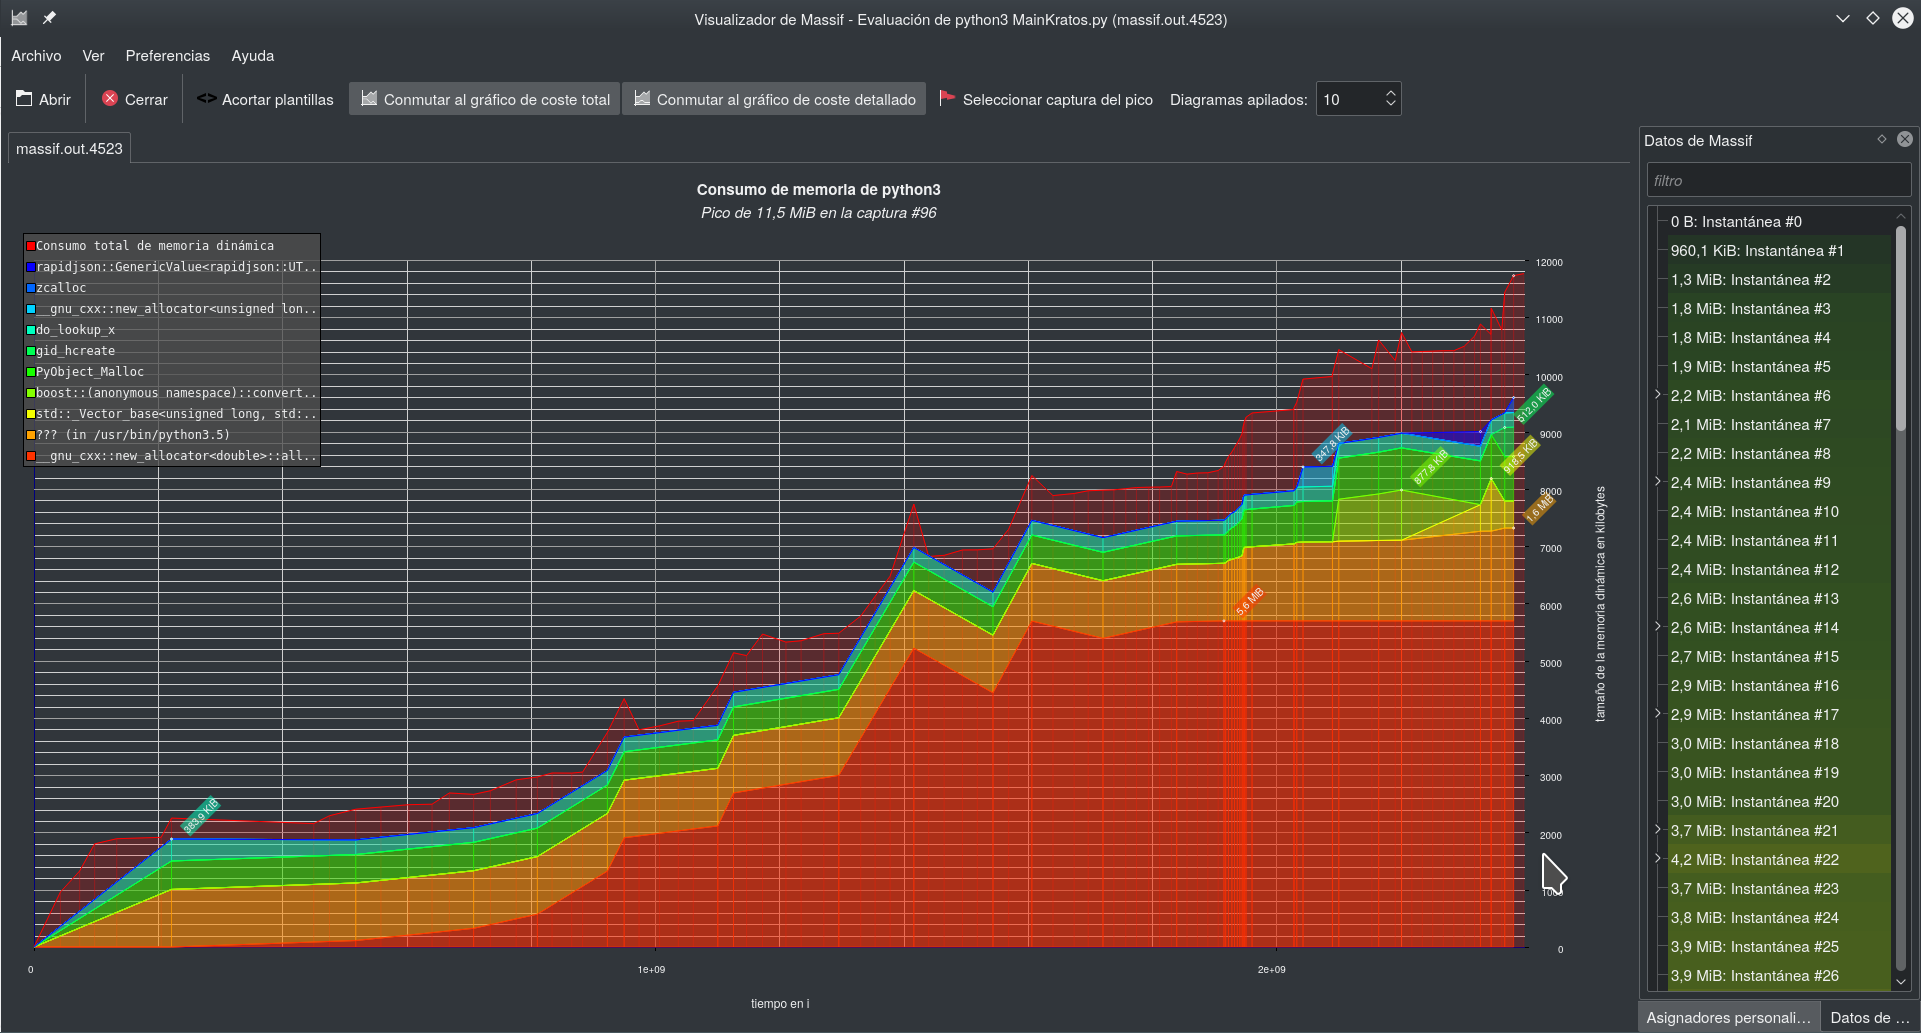
Massiftool can read a Massif output file and displays a graphical version of its contents.
-
On the top left window, the different detailed snapshots are shown. Each snapshot is a record of the memory used by your program at a given moment. Clicking on a snapshot will display it on the right window.
-
On the top right window, you can see the contents of a given snapshot. The top lines display general information, including total memory use. The following lines provide a detailed description of the memory used, recording the object that occupied it. Each entry in a snapshot can be unfolded clicking on the + symbol, which will display additional details. Clicking on an entry will produce a graph on the bottom window, which displays its evolution along the different snapshots.
-
The bottom window displays a graph that shows the time evolution of the item selected in the top right window.
A typical massif output, displayed using massif-visualiser, can be seen in the following screenshot: